ivo.table version 0.7 is now available on CRAN. It adds support for creating gt tables, meaning that you can now create great-looking frequency tables and crosstables in the gt format with a single line of code.
The caption´ argument lets us add a caption.tab_style` can also be used to highlight cells of particular interest:
penguins |>select(species, sex, island) |>ivo_table_gt(caption ="A table with penguins in it") |>tab_style(style =list(cell_fill(color ="darkgreen")),locations =cells_body(columns =5, rows =4))
A table with penguins in it
species
Adelie
Chinstrap
Gentoo
female
Biscoe
22
0
58
Dream
27
34
0
Torgersen
24
0
0
male
Biscoe
22
0
61
Dream
28
34
0
Torgersen
23
0
0
(Missing)
Biscoe
0
0
5
Dream
1
0
0
Torgersen
5
0
0
The best part
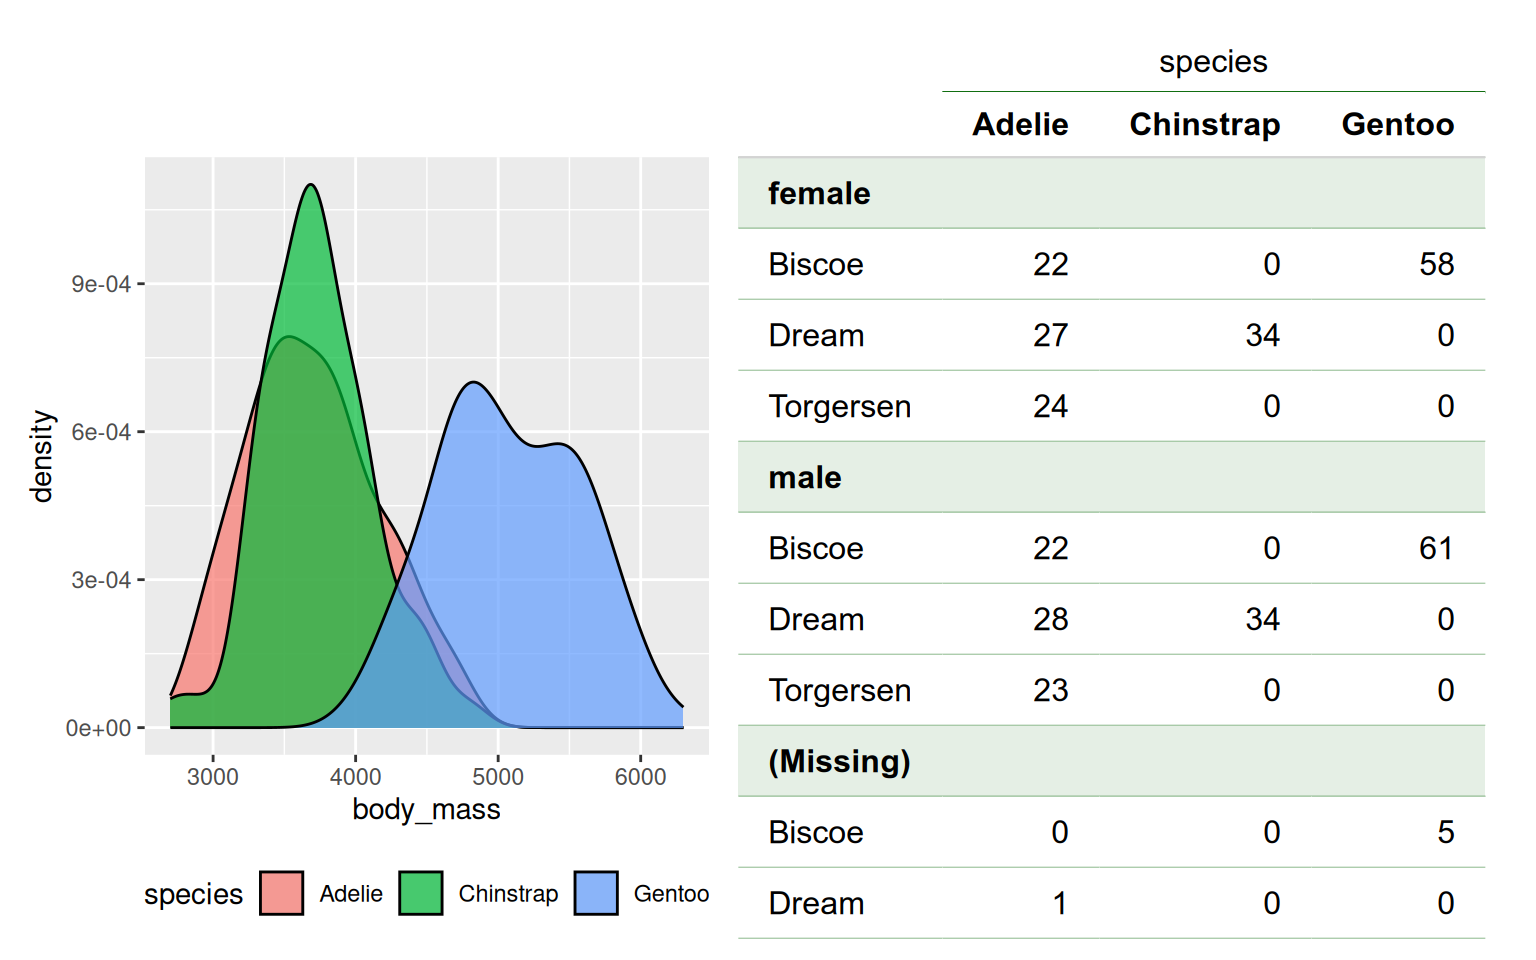
What I think makes using gt tables instead of flextable tables an appealing option is that we can paste them with ggplot objects using the patchwork package, like so: